views
X
Research source
The following article provides guidance on both calculating the PE ratio and using it to analyze stocks.
Calculating the Ratio
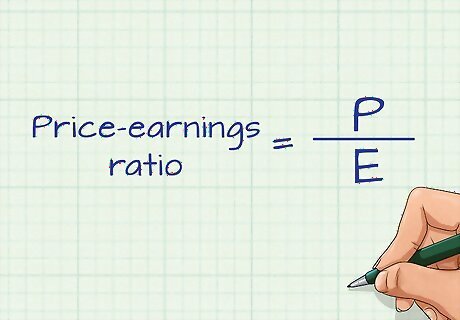
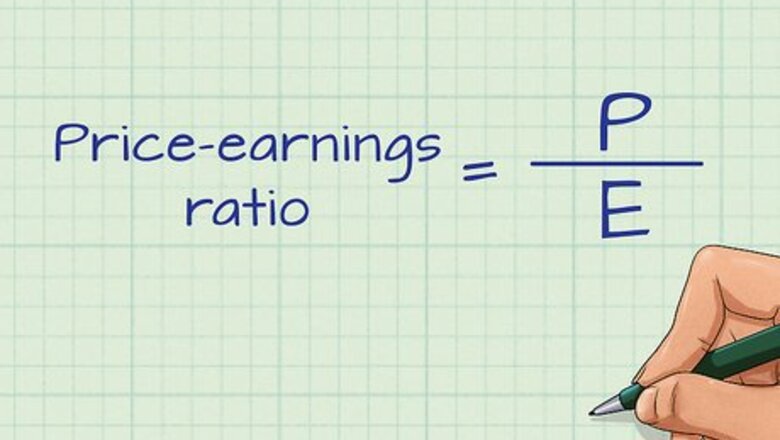
Know the formula. The formula for calculating the price-earnings ratio for any stock is simple: the market value per share divided by the earnings per share (EPS). This is represented as the equation (P/EPS), where P is the market price and EPS is the earnings per share.

Find the market price. Of the two variables used the P/E equation, market price is the easier to find. Market value per share is simply how much it costs to buy a share of any publicly-traded company on the stock Market. On November 4, 2015, for example, it cost $103.94 to buy one share of Facebook. Find a stock's current price by searching online either for its stock symbol (usually four or fewer letters) or the full name of the company followed by "stock." Stock prices are constantly fluctuating and the P/E ratio of a company fluctuates with them. When choosing a market price to use in your calculation, don't worry about choosing any averages, highs, or lows of the stock price; the current price will work fine. The only time you need to choose a specific price is when you are comparing the P/E ratios of two different companies. In this case, the chosen approximation, whether it is the opening price on a certain day or the current price at this minute, should be found in the same way for both companies.

Calculate or find the Earnings per share. Financial analysts generally use what is called a trailing P/E ratio. In this case, EPS is calculated by taking a company's net income over the last four quarters (twelve months), account for any stock splits, and then dividing by the number of shares outstanding. However, they may also use a forward, or projected, P/E ratio that uses expected earnings over the next four quarters. EPS is usually provided on finance websites as a part of a freely available stock report and is easy to find with a web search. If you want to calculate EPS yourself, however, the formula is generally as follows: (Net Income - Dividends on Preferred Stock / Average Outstanding Shares of Common Stock). Note that some sources use the number of shares being traded at the end of the period rather than the average over the period. Because of slight variations in formula, different sources may report different EPS values for the same company. However, these are generally averaged together to produce an average EPS.
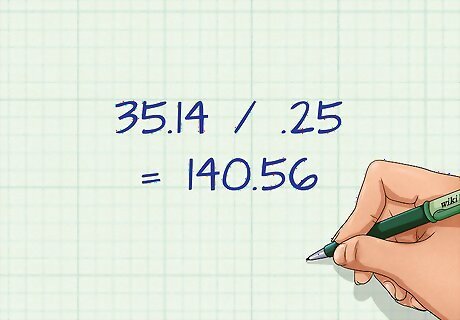
Calculate the price/earnings ratio. Once you have the formula and your two variables, simply input your values to calculate the P/E ratio. Let's try an example using a real publicly-traded company, Yahoo! Inc. As of November 5, 2015, Yahoo!'s stock was trading at 35.14. We have the first part of our equation, the numerator, or 35.14 We'll need to calculate Yahoo!'s EPS. You can just type "Yahoo!" and "EPS" into a search engine if don't want to calculate EPS yourself. As of November 5, 2015, Yahoo!'s EPS was $.25 per share. Divide 35.14 by .25 to get 140.56. Yahoo!'s price-earnings ratio is approximately 141.
Analyzing the Ratio
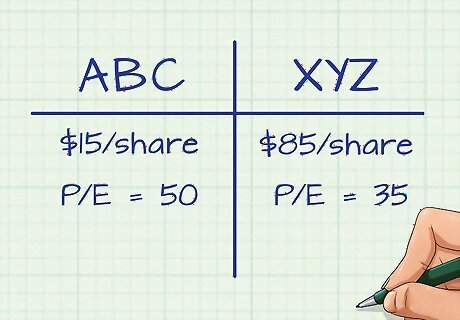
Compare the P/E to other companies in the same industry. P/E by itself is useless; the number doesn't tell you anything unless you compare it to other companies' P/Es in the same industry. Companies with lower P/Es are considered "cheaper" to buy — for how much they earn, their stock price is cheaper — although this analysis alone won't tell you whether to buy a company. For example, Stock ABC is trading at $15/share and has a P/E of 50. Stock XYZ is trading at $85/share and has a P/E of 35. It's cheaper, however, to buy Stock XYZ, even though its share price is higher than Stock ABC's. That's because with Stock XYZ, one pays $35 for every $1 of earnings, whereas with Stock ABC, one pays $50 for every $1 of earnings. Understand that it is useless to compare P/E ratios between unrelated companies. Because valuations and growth rates vary widely between industries, the companies compared must be very similar in both size and sector to be comparable using P/E ratios.

Know that P/Es can be affected by investors' future expectations of a company's value. Although P/E is often thought of as an indication of how the company has been priced in the past, it's also an indication of what investors think of its future. That's because stock prices are a reflection of how people think a stock will perform in the future. Therefore, companies with high P/Es is a sign that investors expect higher earnings growth in the future. Conversely, a low P/E may represent a company that either is undervalued or is doing better now than it has been doing in recent years. In other words, the P/E should not be the sole determining factor in deciding whether or not to buy a stock.

Know that debt or leverage can artificially lower a company's P/E. Taking on a bunch of debt generally increases a company's risk profile, which lowers it's P/E ratio. Higher debt (greater risk) may lower investors' willingness to pay a higher price for the stock but leverage usually increases a company's earnings and thus can increase the PE. However, if profits instead fall, the portion that goes to the stockholders is reduced because debt holders will have to be paid first. That being said, of two companies with the same operations, trading in the same sector, the company with a moderate debt load will have a lower P/E ratio than the company with no debt. Keep this in mind when using P/E as a tool for diagnosing a company's vitals. Keep in mind that, assuming good economic conditions and successful management, the company that takes on more debt, and thus has a lower P/E, can experience higher earnings because of the risky debt it has incurred.


Comments
0 comment