
views
Finding Stock Prices
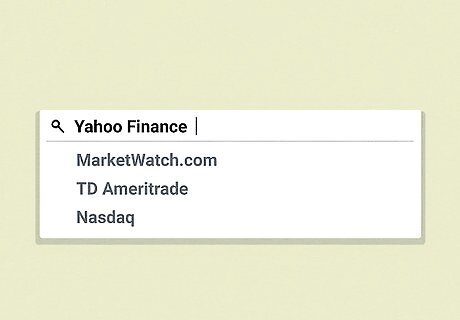
Visit a financial website that lists stock prices. Open up a web browser and search for a stock or finance website that lists stock information. Click on the site and look for a search field you can use to look up a company. There are a ton of finance sites you can use. A few examples include Yahoo Finance, MarketWatch.com, TD Ameritrade, and Nasdaq. Because all of the financial sites pull their info from the stock market, they should all have the same information.
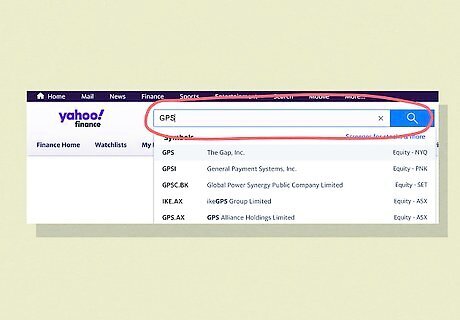
Search for a company by name or using its stock’s ticker symbol. A stock ticker symbol is a unique series of letters assigned to a company for trading purposes. Every company on the stock market has one. Enter your company’s ticker symbol or their name into the company search field to look up their stock info. For example, the clothing brand Gap has “GPS” as its stock ticker and the animation studio Pixar has “PIXR.”

Make sure the data includes the adjusted closing prices. Whenever you pull up the data, look through the information to see what it includes. Find the “adjusted closing prices” data, which will help you calculate your daily returns. Some sites may not include the adjusted closing prices or they may list the estimated closing price. If it doesn’t include the adjusted closing prices (which have been adjusted to be fully accurate), try looking up the company on another finance site.

Download the info for the period of time you’re interested in for reference. If you plan to manually calculate and track your daily stock returns, choose the option to download the data. Save it onto your computer so you can reference and pull the information that you need. Just make sure the data includes the adjusted closing prices. If you’re trying to track your stocks over a period of time, downloading the info may come in handy.
Calculating the Daily Stock Return
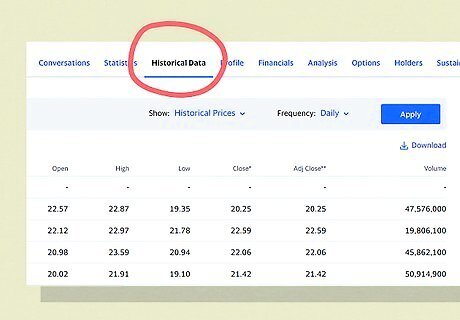
Find the historical prices section of the stock data. Pull up the stock info online or in the data you’ve downloaded. Search through the fields and located the section labeled historical prices. You’ll use these to calculate your returns. If you’re searching the info online and the site doesn’t list the historical prices, try looking it up on another finance site.

Locate the stock’s closing price for a 2-day period. Find the closing prices in the data. Then, locate the closing prices of the previous 2 days, or a 2-day period in the past if you’re trying to review and evaluate a stock’s performance.

Subtract the opening price from the closing price. Locate the opening price of the stock and the closing price. Find the difference between the 2 prices to calculate the price change, which you’ll use to find the daily return. For instance, if the stock opened at $10 a share and closed at $12 a share, then the net change would be $2.
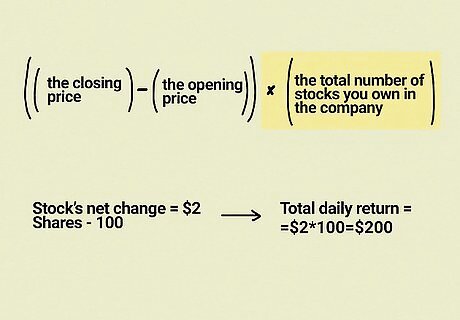
Multiply the difference by the stocks you own to find your total daily return. Find the total number of stocks, also known as shares, you own in the company. Take the difference between the opening and closing prices and multiply it by the shares you own to determine exactly how much your stock increased (or decreased) in value that day. Using the same example, if your stock’s net change was $2 and you own 100 shares in the company, then your total daily return would be $200.
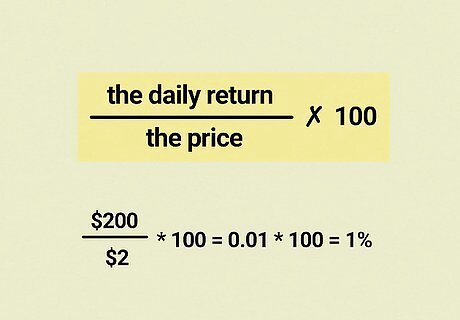
Divide the daily return by the price and multiply by 100 to get a percentage. If you want to find the percentage of your stock’s daily return, take your daily return and divide it by the current stock price. Then, take that value and multiply it by 100 to find out the percentage of the return. If your company’s stock closed at $200 a share and your daily return is $2 a share, you’d divide $2 by $200 to get a value of .01. Multiply that value by 100 to get a 1% increase in the stock’s daily return.
Using an Online Stock Calculator
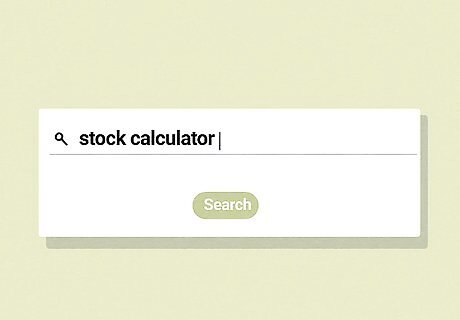
Look up an online stock calculator. Pull up a web browser and hop onto a search engine. Type in terms like “stock calculator” and run a search. Look through the results and choose an online calculator. There are a bunch of stock calculators, but a free one you can use is https://www.buyupside.com/streaks/streakwinloseinput100.php.
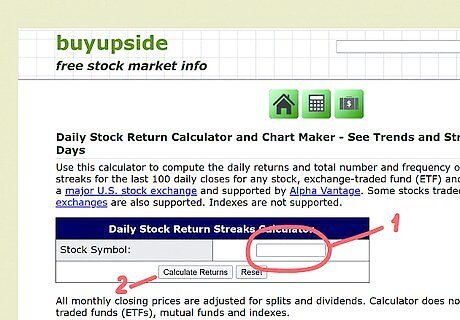
Enter the stock ticker symbol or company name and calculate the return. Find the search field type in your company’s stock ticker symbol. Some sites may also allow you to search by company name. Run a search to pull up your stock’s returns.

Multiply the return by the number of shares you own to get your return. Find out exactly how many shares you own in the company. Then, take the daily return of the company’s stock and multiply the values to get your return. For instance, if you own 30 shares of stock in a company and their daily return was an increase of $1.50 per share, then your return would be $45.
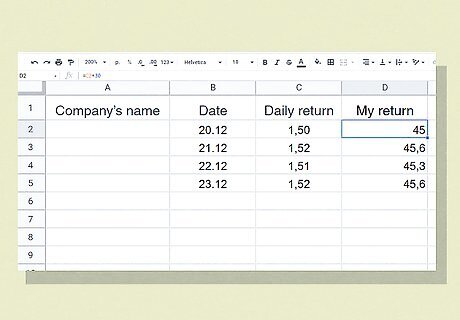
Track your daily returns on a spreadsheet for future analysis. Start a spreadsheet on a program such as Excel or Google Sheets. Enter your company’s name, the date you checked the daily return, and the daily return for the date. Then, add a field to track your return (the daily return multiplied by the number of shares you own). Enter the info into your spreadsheet every time you check your daily return so you can monitor and evaluate how well your stocks are performing.
Reviewing the Stock’s Overall Performance
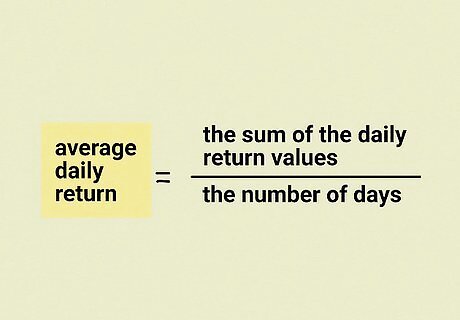
Find your average daily return to evaluate your stocks. Choose a period of time to evaluate your stock’s performance such as a year or a 6-month period. Add together the daily return values and then divide by the number of days in the time period to find out how much your stock’s price moves on an average day. For instance, if you’re evaluating your stock over a 3-week period, you’d add together all of the daily return values and then divide by 21 to see how the stock performs on average. Another way to help evaluate a stock is to calculate its volatility to find out how variable its price is. Stock volatility is a numerical indication of how much the price of a specific stock varies. Remember, there's no way to predict what a stock will do over time—you can really only evaluate how it's currently performing.
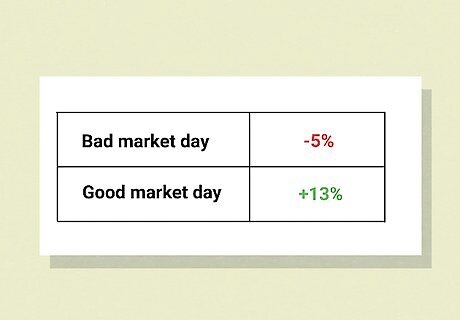
Check your daily return after good or bad market days. Once your money is invested, you generally don’t have to do anything except allow the market to generate passive income on your stocks. But after a really good or a really bad day for the market, check your daily returns to get an idea of how your stocks are impacted. For instance, if you hear that the market had a record-setting day, check your daily return to see how well your stocks did.
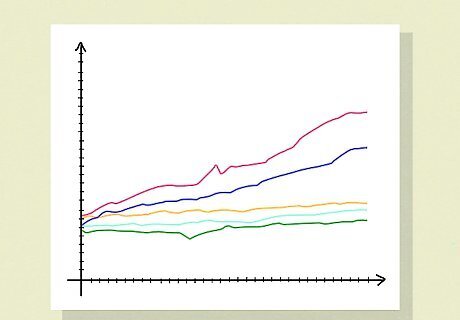
Invest in stocks that perform well together by calculating the correlation coefficient. If you own stock in multiple companies, find out if they’re both performing well and seem to be correlated. Use the correlation value to help decide which of your stocks you want to invest more in and which ones you want to start thinking about selling. For instance, if you’re investing in 5 companies, and the stocks of 2 of them are both increasing in value, you could start investing more into them and less into the other 3 companies. Ideally, you should invest in a variety of stocks to protect your money. That way, if one performs badly, you won't lose everything you've invested.


Comments
0 comment