
This works on Windows and Mac!
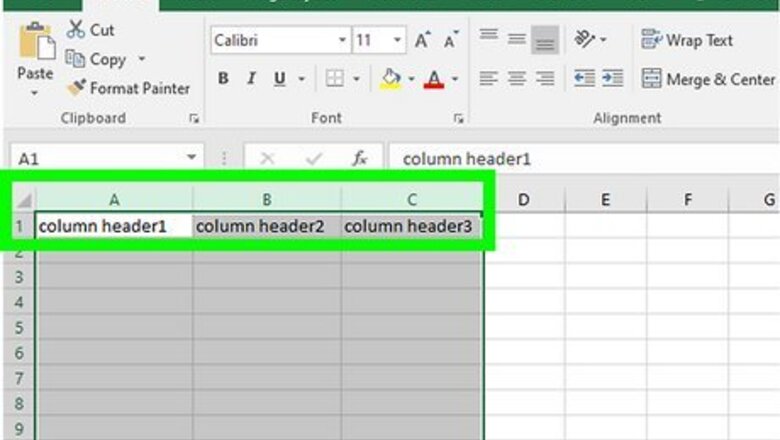
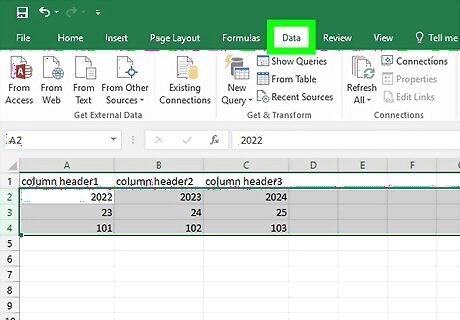
- Prepare your data by making column or row headers and getting rid of blank rows and columns.
- Outline rows or columns automatically by selecting a cell in the data and going to Data > Group > Auto Outline.
- For the manual method, click the Group button and choose “Rows” or “Columns.”
Preparing Your Data
Organize the data you want to outline. Each column should have a column header in the first row. Make sure the range you’re going to outline doesn’t contain blank rows or columns. For a general spreadsheet guide, check out how to make a spreadsheet in Excel and format it. If you’re looking for Excel database info, read our guide on creating a database from an Excel spreadsheet.
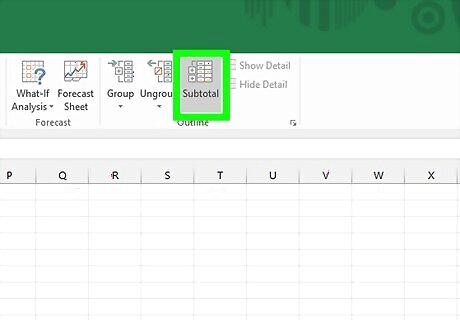
Optionally, create a summary row. This is also called a subtotal. You have two options for this: Select a cell in the data range. Go to the Data tab and click Subtotal in the Outline group. Insert summary rows with your own formulas. For example, you could use the SUM function to subtotal information. These can go above or below the data. If you place your summary rows above the data, open the dialog box in the Outline group of the Data tab (it’s the right angle with an arrow). Uncheck “Summary rows below detail.”
Outlining Automatically
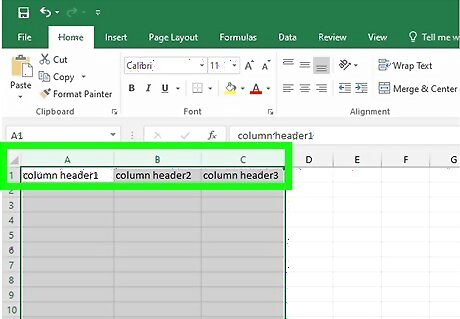
Select a cell that’s in the range you’re going to outline. This can be any cell in the data. Your data must have column headers and no blank lines for this feature to work.
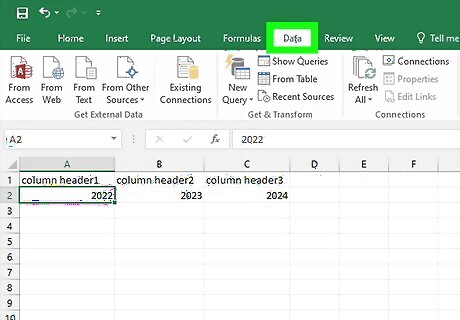
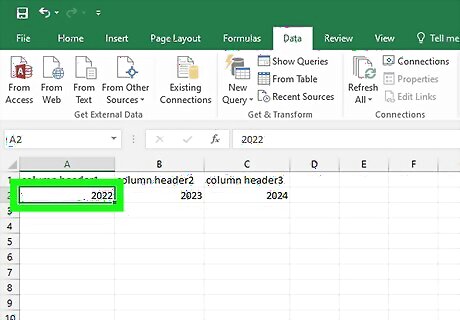
Click the Data tab. It's on the left side of the green ribbon that's at the top of the Excel window. Doing so will open a toolbar below the ribbon.
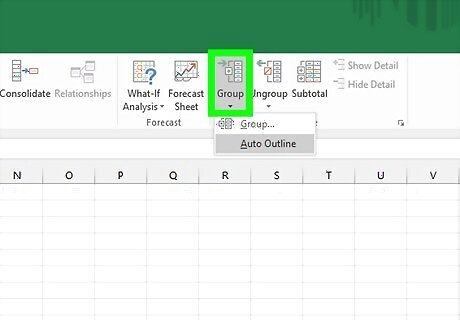
Click the down arrow under the Group button. You'll find this option on the far-right side of the Data tab. A drop-down menu will appear.
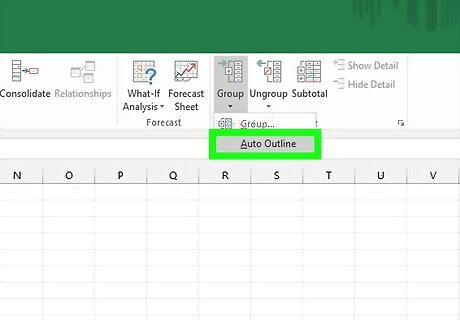
Click Auto Outline. It's in the Group drop-down menu. If you receive a pop-up box that says "Cannot create an outline", your data doesn't have an outline-compatible formula in it. You may also have some blank cells in your data or missing column headers. You'll need to manually outline the data.
Outlining Manually
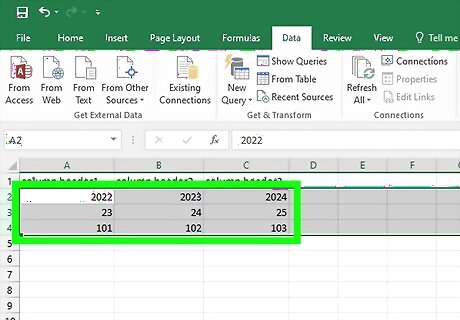
Select your data. Click and drag your cursor from the top-left cell of the data you want to group to the bottom-right cell of the data.
Click Data if this tab isn't open. It's in the left side of the green ribbon at the top of Excel.
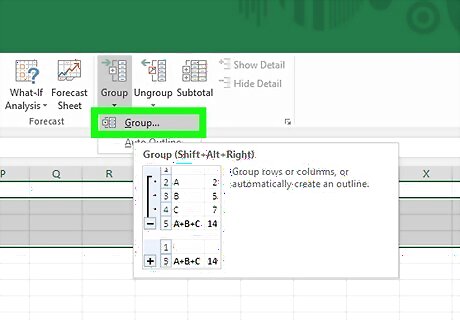
Click Group. It's on the right side of the Data toolbar.
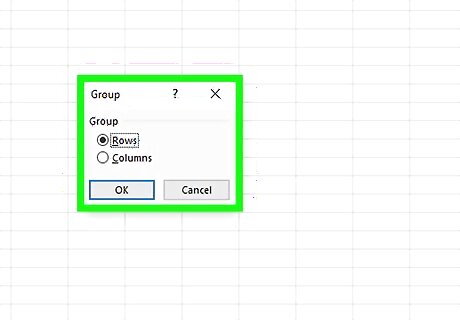
Select a group option. Click Rows to minimize your data vertically, or click Columns to minimize horizontally.
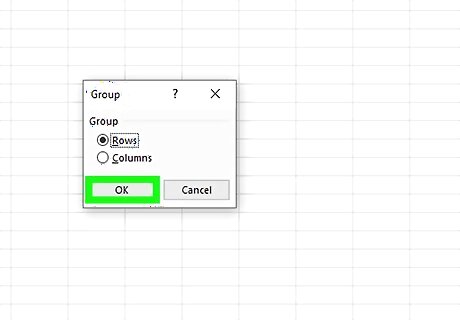
Click OK. It's at the bottom of the pop-up window. Your grouped data is all set!
Minimizing & Clearing
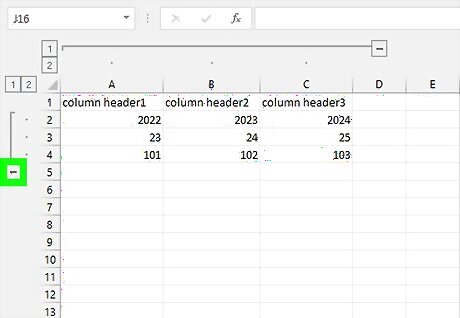
Minimize your data. Click the [-] button at the top or on the left side of the Excel spreadsheet to hide the grouped data. In most cases, doing this will only display the final line of the data.
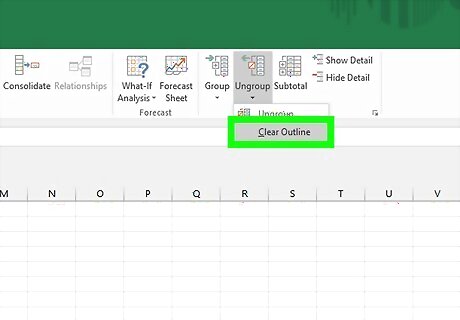
Clear your outline if needed. Click Ungroup to the right of the Group option, then click Clear Outline... in the drop-down menu. This will ungroup and unhide any data that was minimized or grouped previously.


Comments
0 comment