views
Reviewing the Basics
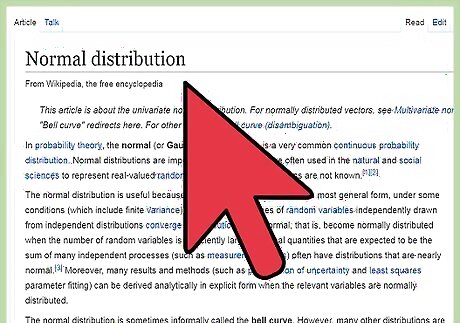
Understand Normal Distributions. In the real world the values of many random variables -for example, the heights of adult males in the United States- are normally distributed. That is, the bulk of the values are around the mean of the distribution.
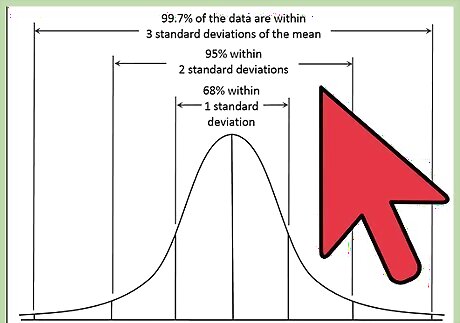
Know the 68 95 99.7 Rule. A normal distribution is a continuous probability distribution in which 68% of the values are within one standard deviation of the mean, 95% are within two standard deviations, and 99.7% are within three standard deviations.
Learning the Functions
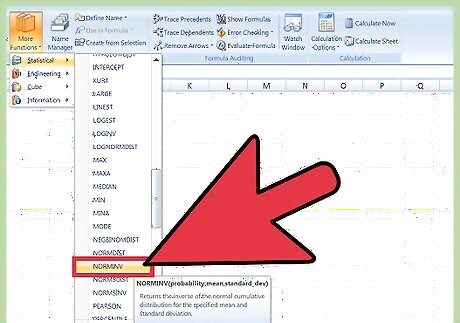
Learn NORM.INV. In Excel, the NORM.INV function returns a normally distributed value given a probability, a mean, and a standard deviation. NORM refers to a normal distribution with a given mean and a given standard deviation. and INV refers to inverse, that is, finding a value given a probability, rather than finding a probability given a value.
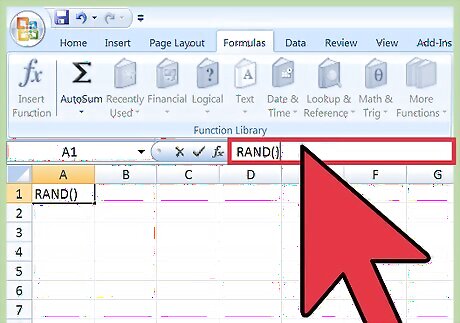
Get to know RAND(). The RAND() function returns a random number between zero and one.
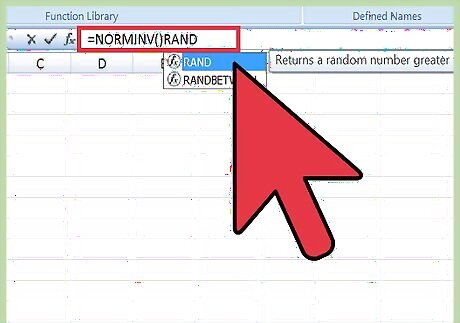
Learn to combine functions. Combining the two above-referenced functions returns a normally distributed random value with a given mean and a given standard deviation.
Creating the Sample
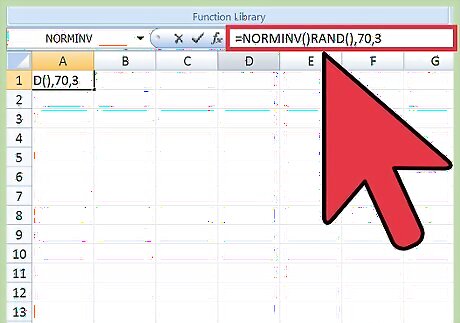
Entering the combined function. To create a random sample of a normal distribution with a mean of 70 and a standard distribution of 3, enter the above-referenced combined function in cell A1.
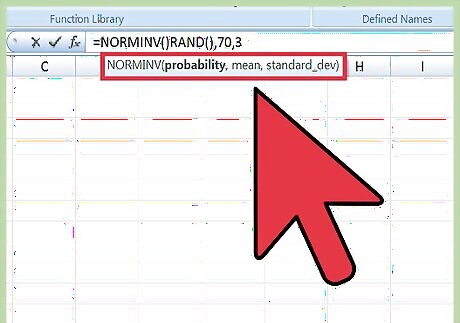
Replicate the Combined Function. To create a sample of size 10, copy cell A1 to cells A2 to A10.
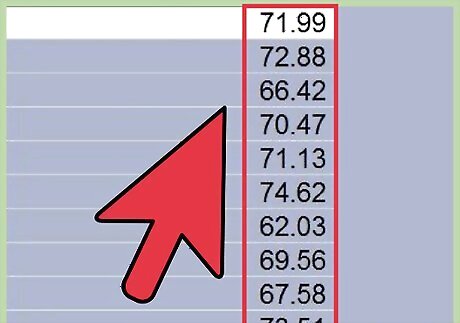
View the Results. Excel displays the random sample of a normal distribution with a mean of 70 and a standard deviation of 3.


Comments
0 comment