
Assembling the Data
Open the Microsoft Excel program. You can also open an existing Microsoft Excel document if you have one that correlates to your random sample needs.
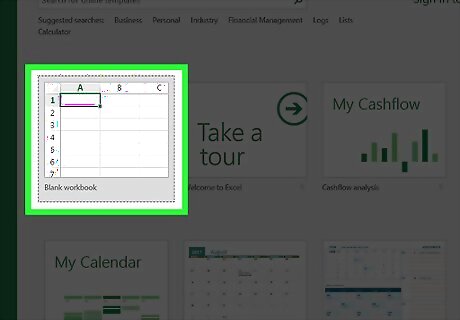
Select Blank workbook. If you aren't opening a new document, skip this step.
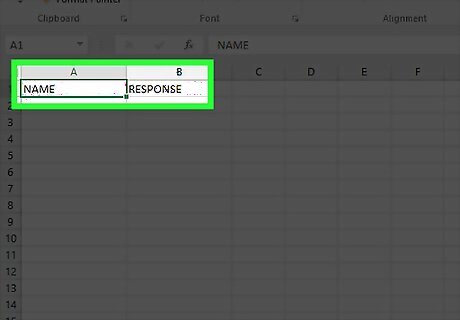
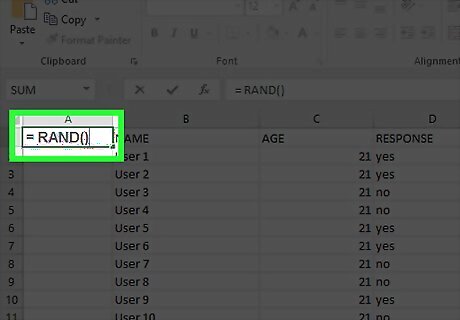
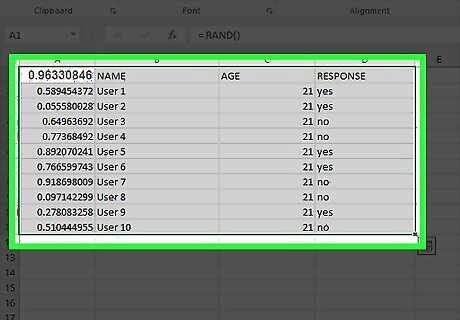
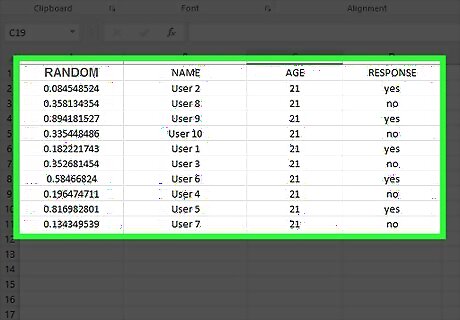
Enter your data. To do this, click on a cell into which you wish to input data, then type in your data. Depending on the type of data you have, this process will vary. However, you should start all data in the "A" column. For example: you might place your users' names in the "A" column and their responses to a survey (e.g., "yes" or "no") in the "B" column.
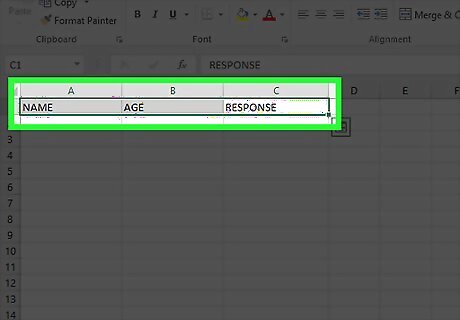
Make sure you have all relevant data entered into your spreadsheet. Once you're positive that you've added all necessary data, you're ready to generate your random sample.
Creating a Random Sample
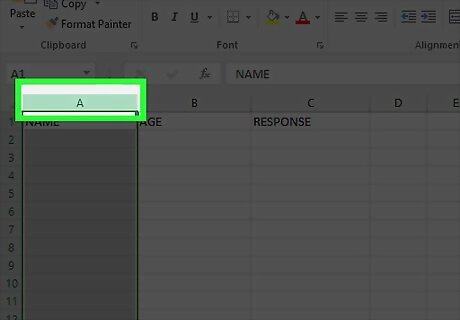
Right-click the far left column's name. For example, if all of your data begins in column "A", you'd right-click the "A" at the top of the page.
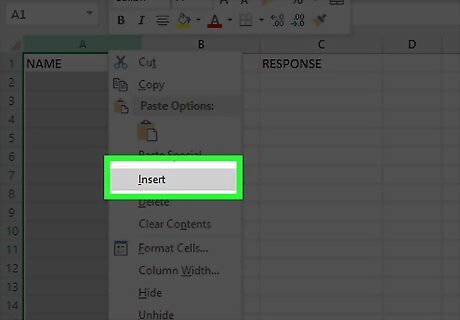
Click Insert. This will add a column to the left of your current left column. After doing this, any data that was in the "A" column will be relisted as being in the "B" column and so on.
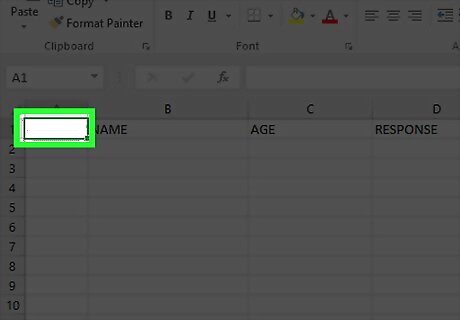
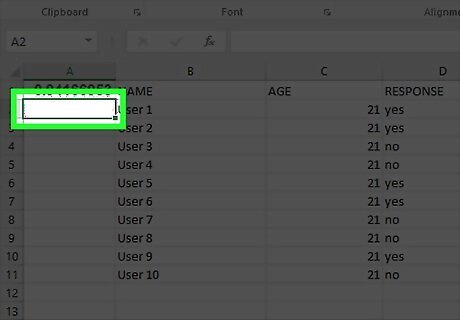
Select the new "A1" cell.
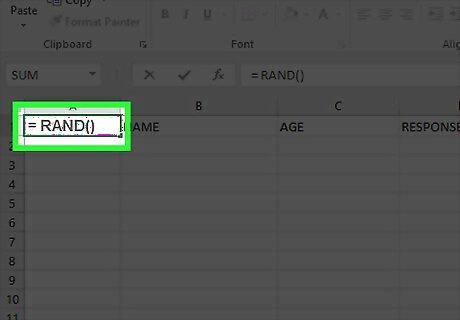
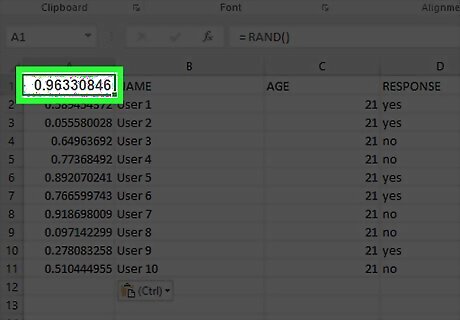
Type "= RAND()" into this cell. Exclude the quotation marks. The "RAND" command applies a number between 0 and 1 to your selected cell. If Excel attempts to automatically format your "RAND" command, delete the formatting and re-type the command.
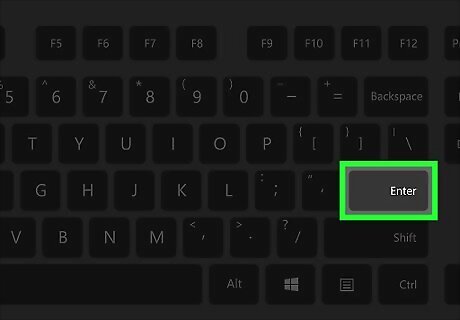
Press ↵ Enter. You should see a decimal (e.g., 0.5647) appear in your selected cell.
Select the cell with the random sample number.
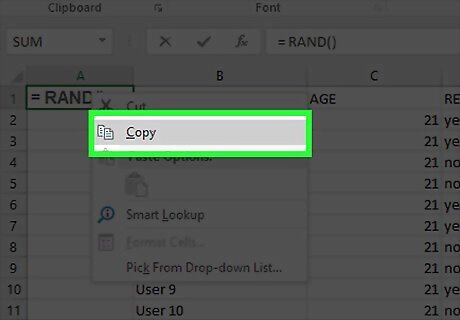
Hold down Control and tap C. Doing this will copy the "RAND" command. For a Mac, you'll hold down ⌘ Command instead of Control. You can also right-click the "RAND" cell and then select Copy.
Select the cell below your random sample number. This will likely be the "A2" cell. Clicking the "A1" cell and highlighting from there can cause a sorting error.
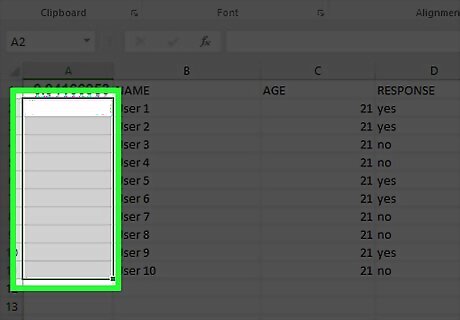
Highlight the rest of the random sample cells. To do this, you'll hold down ⇧ Shift while clicking the cell at the bottom of your data range. For example, if your data in columns "B" and "C" extends all the way down to cell 100, you would hold down ⇧ Shift and click "A100" to select all "A" cells from A2 to A100.
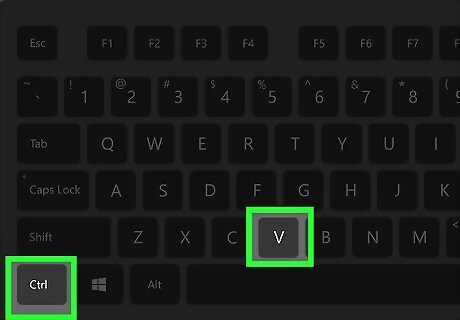
Hold down Control and tap V. Doing so will paste the random sample command into all selected cells (e.g., A2 through A100). Once this is done, you'll need to sort your data using the random numbers to reorder your results. Again, Mac users will need to hold down ⌘ Command instead of Control.
Sorting the Sample
Select the top left cell. In most cases, this will be the "A1" cell. Before you can sort your sample, you'll need to highlight all of your data. This includes the random sample numbers to the left of your data as well.
Hold down ⇧ Shift and select the bottom right cell. Doing so will highlight all of your data, making it ready for sorting. For example, if your data takes up two columns of 50 cells each, you would select "C50" while holding down ⇧ Shift. You can also click and drag your cursor from the top left corner to the bottom right corner of your data (or vice versa) to highlight it.
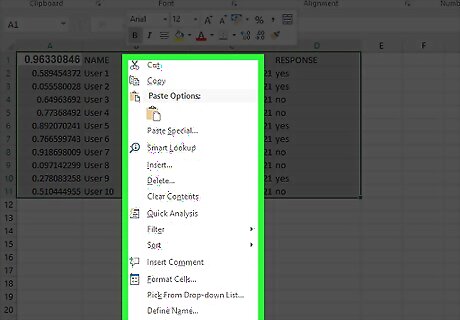
Right-click your data. This will bring up a context menu with options that will allow you to sort your data. If you're using a Mac, you can click using two fingers (or hold down Ctrl and click) to bring up the context menu.
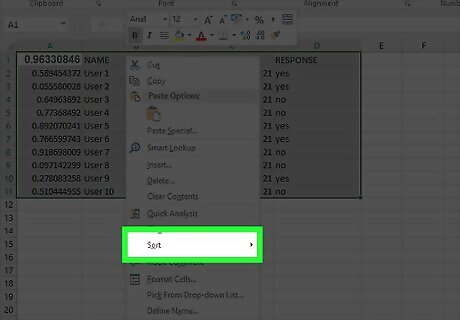
Hover your cursor over Sort.
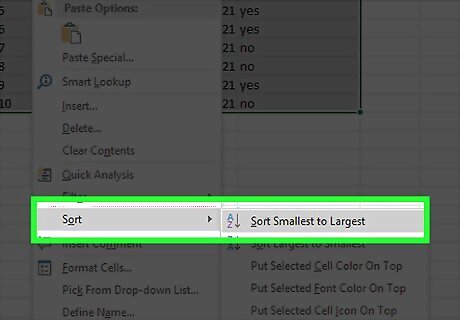
Click Sort Smallest to Largest. You can also click Sort Largest to Smallest here--the only thing that matters is that your data is reorganized randomly according to the "= RAND()" values in the "A" column.
Review the sorting results. Depending on how many results you need, your process from here will vary. However, you can do a couple of things with the sorted data: Select the first, last, or middle half of the data. If your number of data points is too large to warrant this, you can also settle on a lower fraction (for example, the first eighth of the data). Select all odd- or even-numbered data. For example, in a set of 10 data points, you would either pick numbers 1, 3, 5, 7, and 9, or 2, 4, 6, 8, and 10. Select a number of random data points. This method works best for large sets of data where picking half of the information is too ambitious.
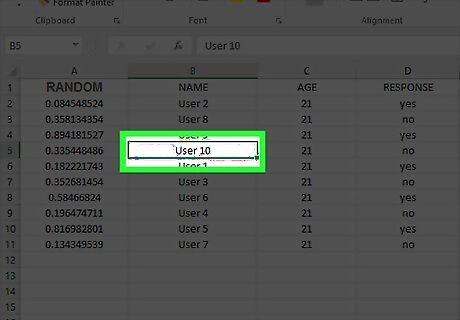
Choose your random sample participants. Now you have a non-biased sample pool for a survey, product giveaway, or something similar.


Comments
0 comment