views
Creating a Gantt Chart from Scratch in Word
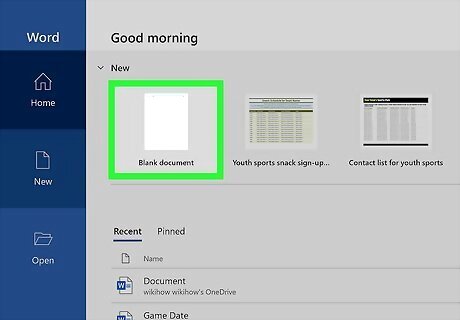
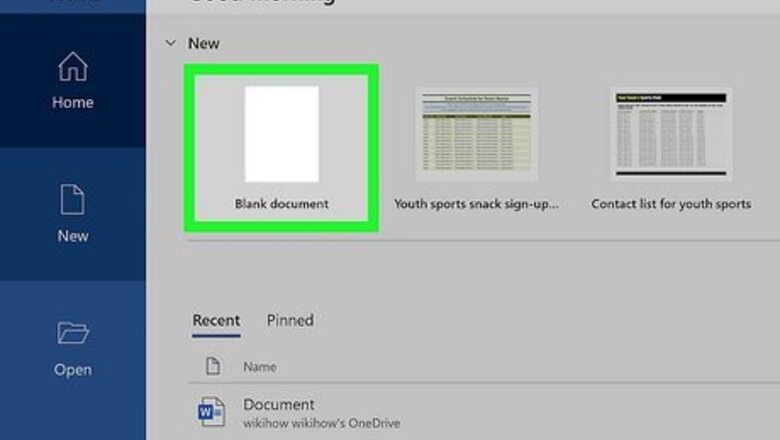
Create a blank Microsoft Word document. You can do this by launching Microsoft Word on your Pc or Mac and selecting Blank. There is no Microsoft Word template for Gantt charts, but you can still create one using Word's stacked bar chart builder.
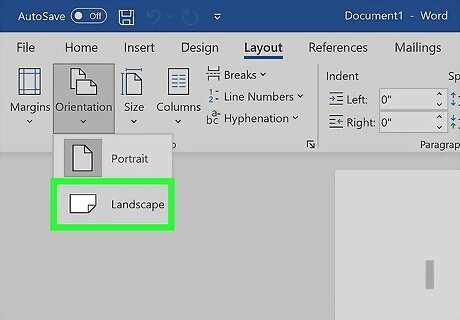
Change the orientation to Landscape. Since Gantt charts are wider than they are tall, it may be helpful to place your document into Landscape mode, which you can do by clicking the Layout menu at the top of word and choosing Orientation > Landscape.
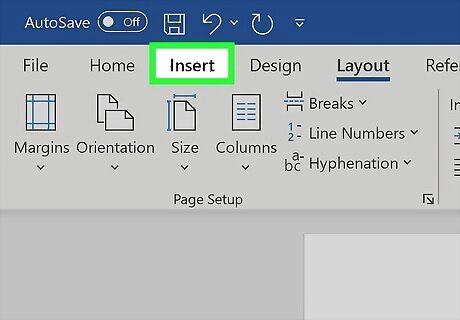
Click the Insert menu. It's at the top of Word.
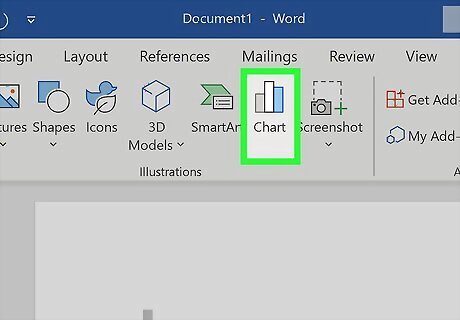
Click Chart. It's in the "Illustrations" bar at the top of Word.
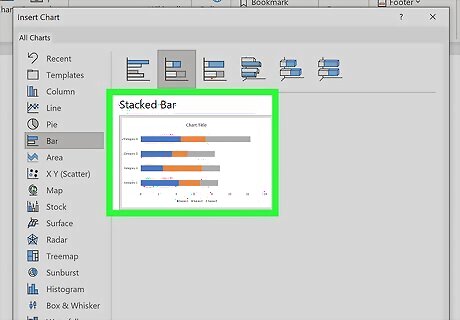
Select the Stacked Bar chart and click OK. To find this type of chart, click Bar on the left side, and then click the second bar chart icon at the top of the screen. This inserts a simple 4-category bar chart into your document. It also automatically opens a small window that looks like Microsoft Excel called "Chart in Microsoft Word."
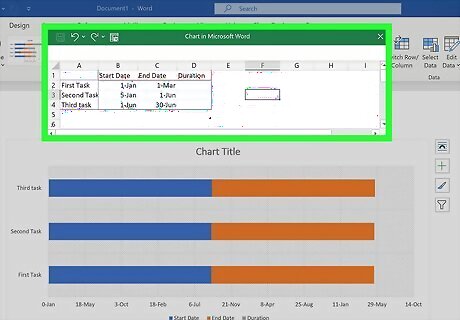
Enter the data for your Gantt chart. In the small Excel-looking window that appeared, replace the example text with your own text. Since you're creating a Gantt chart, you'll want to include columns for the Start Date, End Date, and Duration of each task, and then list each task on its own row. Leave the Duration column blank, as you'll use a formula to calculate each task's duration. Here's an example of how your chart data may look with dates added: Start Date End Date Duration First Task 1/1/2022 3/1/2022 Second Task 1/5/2022 6/1/2022 Third task 6/1/2022 6/30/2022
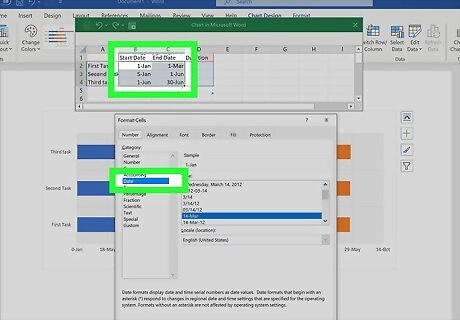
Format the dates in the chart. The chart format will need to know that the dates you enter are in fact dates. Here's how you can do this: Select the two columns containing your dates. To select multiple columns, hold down the Control key (PC) or Command key (Mac) as you click each column letter. Right-click the highlighted columns and select Format cells. Click Date in the left panel. Select the format in which you want dates to display and click OK.
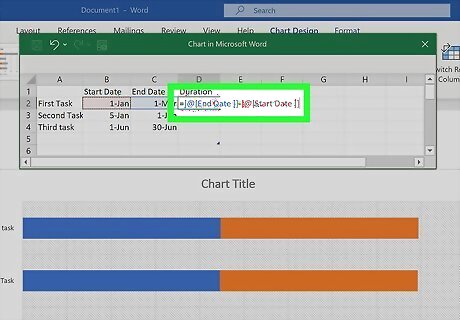
Create a formula to calculate the duration of each task. Assuming you want to use the number of days as the task's duration, all you'll need to do is create a formula that determines how many days occur between the start date and end date of each task. Here's how: In cell D2 (the first empty cell in the Duration column), type =C2-B2 and press Enter or Return. The number of days between the two dates will appear in the cell. It should also automatically calculate the duration for the remaining rows. If the rest of the rows aren't calculated automatically, hover your mouse cursor over cell D2 until you see a dot at its bottom-right corner, and then drag that dot downward until you reach the bottom of your data.
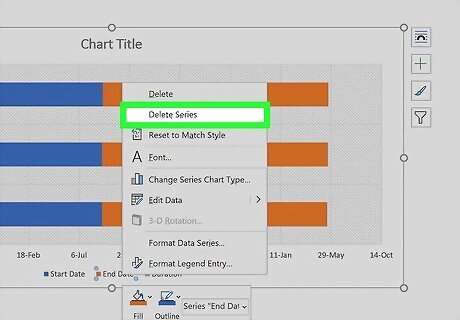
Delete the "End Date" series. To do this, just double-click End Date in the chart legend at the bottom to select it, and then right-click the selection and choose Delete Series. Now you'll just have some simple blue bar lines.
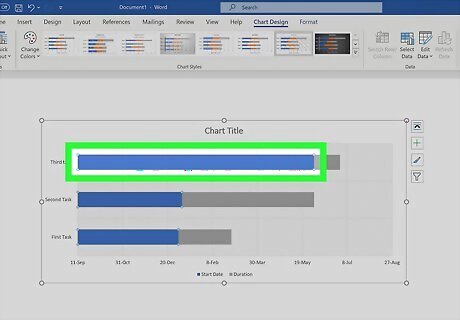
Click any of the blue bars. You'll see the Format panel appear on the right side of Excel.
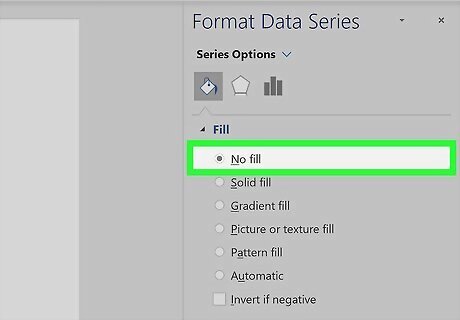
Remove the fill from the blue bars. To do this, just click the paint can icon at the top of the right panel, expand the Fill section, and then click No fill. This removes the blue filling from the chart and displays the actual task durations like a Gantt chart—shaded areas that represent the durations. You can change the color of a shaded bar to make it stand out more. Just click it once, select Fill, and choose a color.
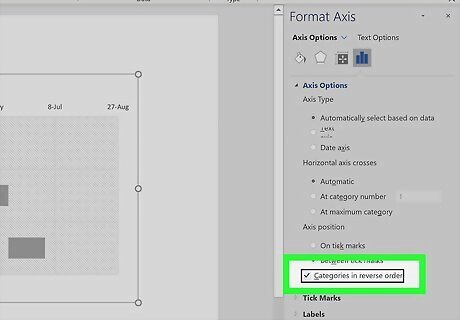
Reverse the task order. The tasks in your Gantt chart are out of order right now, so you'll want to change the order. Here's how: Click anywhere inside of the chart. Click the Chart Options menu at the top of the right panel and select Vertical (Category) Axis. Expand the Axis Options heading. Check the box next to "Categories in reverse order."
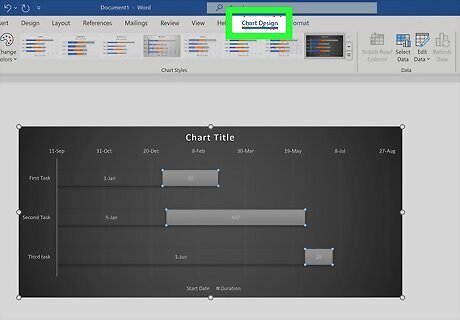
Customize your chart. Now that you have your Gantt chart formatted, you can modify it how you'd like. If you need to add or edit data, you can do so in the Excel window. If you lose that window, click the chart, select the Chart Design tab at the top, and then click Edit Data. To delete the legend at the bottom, just right-click it and select Delete. You can modify the chart's title or delete it altogether. Click Change colors in the toolbar to adjust the color scheme of the chart.
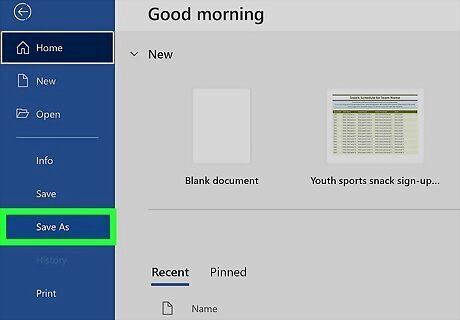
Save your Gantt chart. Now that you've created your chart, you can save it in any format you want. Click the File menu and select Save as (or Save as copy) to save your chart as a .DOCX if you want it to remain editable, or as a .PDF if you want to be able to send it easily in an uneditable format.
Using a Gantt Chart Template in Excel
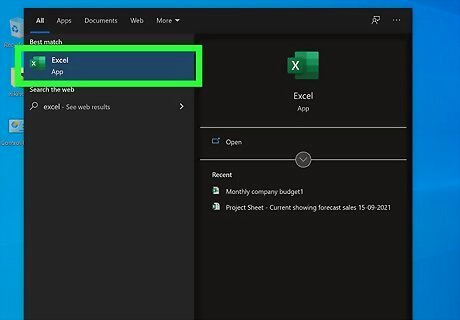
Open Microsoft Excel. Microsoft 365 offers several easy-to-use Gantt templates for Microsoft Excel. Using a template is the easiest way to create a Gantt chart in any Office app. After creating your Gantt chart from a template, you can easily save the chart as a PDF, Word .DOCX, or any other easy-to-send file type.
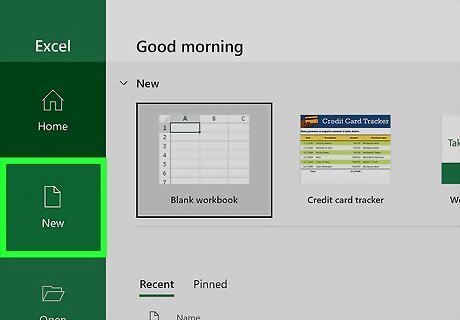
Click New. This option is in the left panel.
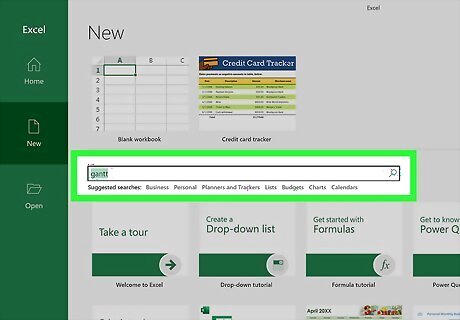
Search for Gantt templates. To do this, just type gantt into the search bar at the top and press Enter or Return. Several Gantt chart templates will appear.
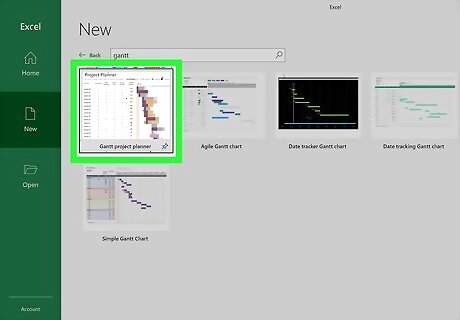
Click a Gantt template to check it out. When you click a template, you'll see a preview of what it could look like, as well as a summary of its features. Microsoft recommends their cohesive Gantt project planner template, but there are several from which you can choose. Try the Date tracking Gantt chart for an easy-to-use, date-oriented Gantt chart, or Agile Gantt chart for a similar template but with Agile terms (including the ability to mark risk levels and specify task owners). For a simple, dated Gantt chart format with space for multiple phases, try the Simple Gantt Chart template. This chart lets you enter a start date, specify tasks and their assigned owners/teams,
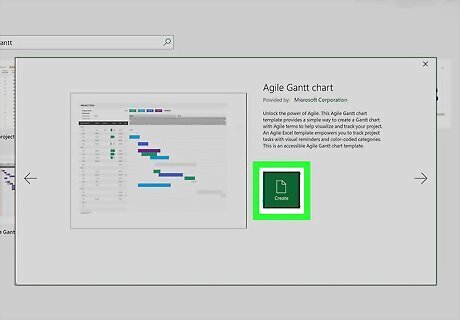
Click Create to create your chart. This downloads the template from Microsoft and opens it in Excel.
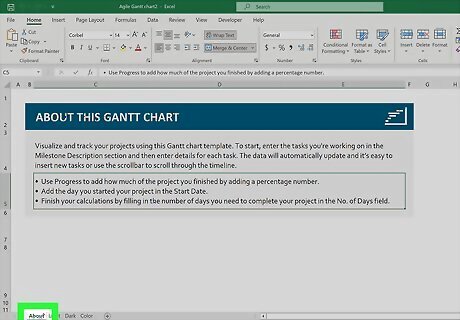
Find the instructions for the template you selected. Each template has instructions, which you'll find on a separate tab called "About" or in hidden text on the sheet itself. Look for an About tab at the bottom of the sheet. If you see one, click it to learn how to use the template. If your template doesn't have an About tab, double-click A1 on the Gantt chart for instructions—you'll see the instructions at the top of the sheet in the "fx" bar.
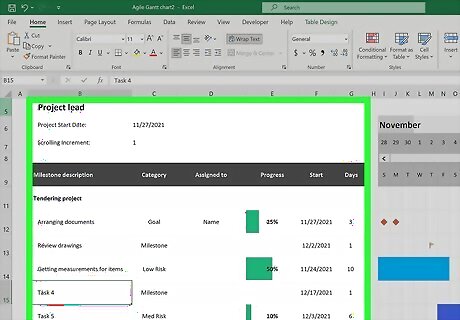
Fill out the details for your chart. The steps are a little different depending on the Gantt template you chose and the information you want to display. Replace the template text, such as "Project name" and "Project lead" with the information for your project. Replace any dates with the actual dates of your project's timespan. Enter tasks, task assignments, priorities/categories, start dates, end dates, and other information on each provided line. As you enter information, the chart will update automatically. If there are rows in the chart that you don't need, you can remove them easily—right-click a row's number and select Delete.
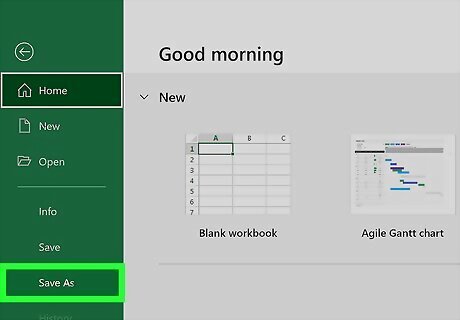
Save your Gantt chart. Once you've filled out the template, you can save it in a variety of formats. Just click the File menu, select Save as (or Save as copy), and choose the desired file format. If you want to save the chart in a non-editable format you can send to others, save it as a PDF. This is handy if you need to attach a Gantt chart to a job or grant application. If you want people to be able to edit the Gantt chart with their own info, save it as an Excel spreadsheet (.XLSX). You can also copy the contents of your Gantt chart and paste it into a Word document. To copy it, use the mouse to select the entire chart, and then press Control + C (PC) or Command + C (Mac). To paste as an editable chart, just click the mouse at the desired location and press Control + V (PC) or Control + V (Mac). To paste as an image, right-click the desired location and click the icon of a clipboard with a picture.




Comments
0 comment